Your personal data scientist for market research
- Localize green fields and discover white spaces
- Build hyper-relevant targeting lists
- Combine your own data with our data
- Deep insights into your market, target group and customers
- Increase the ROI of your campaigns

Market Insight
Market Insight
Introduction
D&B Market Insight
True understanding of your market, target group and customers
Easily discover up- and cross sell opportunities
Increase the ROI of your market spending
Deep insights into customer, market and behavior
How it works
Everything you need to understand your customers
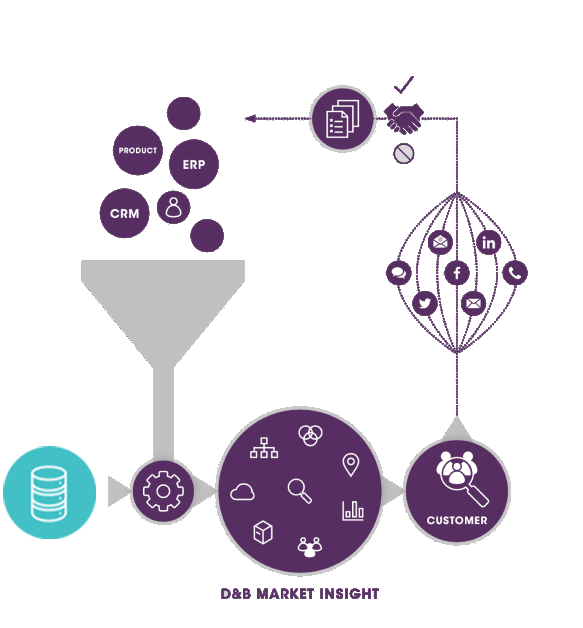
Market Insight is a comprehensive data exploration and visualization tool that will help your business understand your market space and your customer behavior. Market Insight is built for Big Data. It comes with Dun & Bradstreet’s Data Cloud giving you access to over 235 million active company records at the click of a mouse.
To build a Single Customer View you can add your customer data to Market Insight. This enables you to easily browse and analyze all your data in a single Data Platform. D&B Market Insight is easy to deploy, allowing you to start right away.
- More profitable customers
- Increase market share
- Localize green fields and discover white spaces
- Increase the ROI of your market spending
- Easily discover up- and cross sell opportunities
Bring internal and external data together in a powerful tool
Effective January 1, 2019, Altares Dun & Bradstreet has entered into a partnership with RedshanksRedshanks will take over the support activities for D&B Market Insight with immediate effect and will become the first point of contact for our clients. For the commercial activities, they will work closely with the Altares Dun & Bradstreet account managers.

Facts about D&B Market Insight
275M+
Active company profiles
29M+
Hierarchy members
375M
Daily updated data elements
226
Markets worldwide
Market Insight
Features
Produce intelligent segmentation
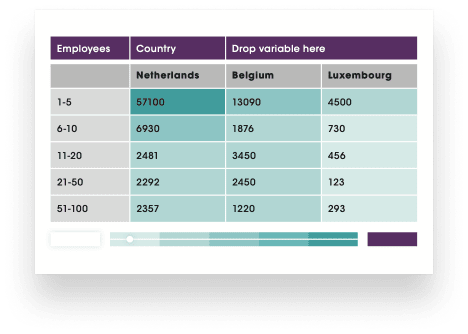
Selections are flexible and simple to manipulate, which means you can drill down into the data to uncover valuable insights & quickly build large datasets saving you time. Selection is at the core of all the work within market insight, enabling you to identify, count and later analyze a segment of your data.
- Easily drag and drop data elements to build your selection;
- Identify segments for highly targeted campaigns
- Use all available data variables to make precise segmentations
- Analyze your market space to discover new opportunities
- Create your audience using Boolean logic
- Use waterfall counts per data element to see what you are building
- Create and save templates for quicker analysis
- Use previous segmentations for a quick start
- Schedule standard tasks to run automatically

Discover how each variable relates to another
Break down data by using cubes, to gain a deeper understanding of the selected group. Discover interesting insights through thematical shading.
- Examine relationships within data
- Perform calculations between cells
- Drag & drop highlighted cells to narrow down your selection
- (Un)fold nested data to reveal multidimensional categories using tree view
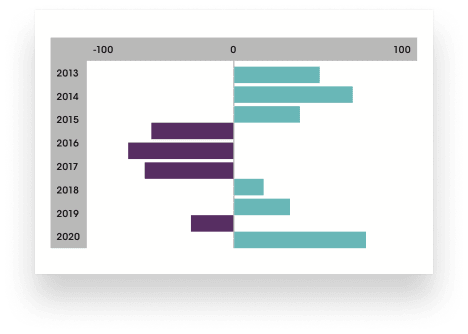
Visualize your insights
Are you more in to visually exploring your data? With charting you can deep dive into specific segments to get a better understanding. Quickly drill down into the details and create beautiful visualizations that you can share with your colleagues. Choose what type of chart you would like to use and customize colors, legend and labels.
- Switch between an array of chart and graph types
- Create stunning visualizations to better communicate findings
- Retrace your steps using the Analyses Trail
- Further explore a specific outcome
- Share your findings as a visual representation
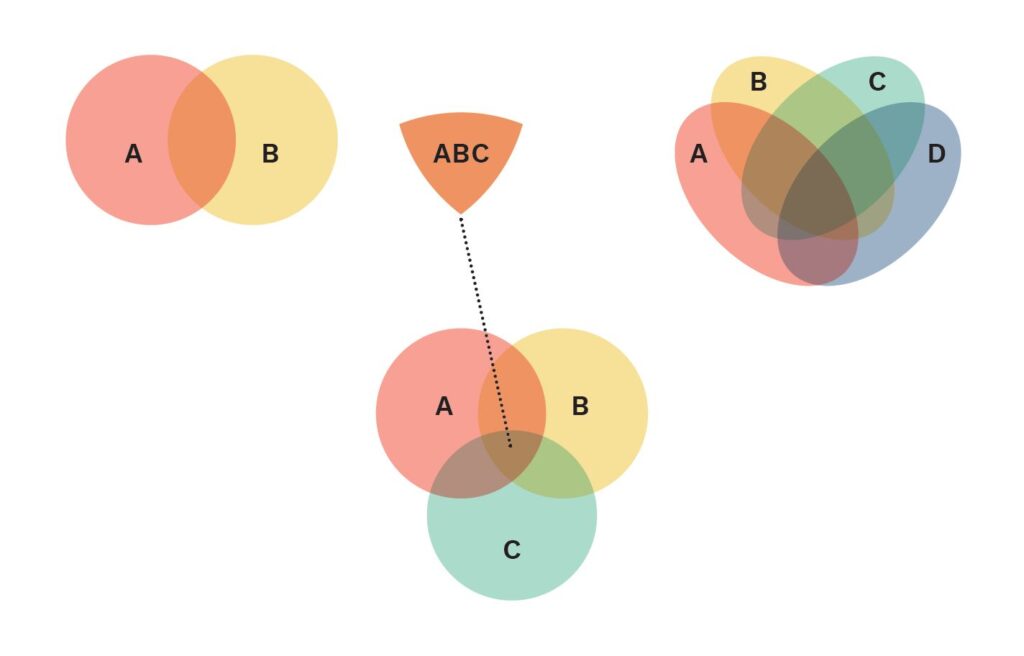
Colorful ellipsis of interrelations
easily perform cross- and upselling analysis between product ranges or customer segments and select elements of any visualization to generate new highly targeted selections to optimize response rates.
- Use actionable Venn diagrams to easily identify similarities and differences
- Derive insights & patterns within chosen variables
- Compare datasets, discover correlations and predict the likelihood of something happening
- Customize the color scheme to match your company look and feel
Mapping has never been easier
Discover where your customers and prospects are located and use heat mapping to pin-point areas of high concentration.
- Discover patterns in the geographical spread of your customers
- Gain insight by visualizing the locations of customers and prospects
- Find new target areas of untapped potential to increase sales
- Pin a location and discover businesses in a certain radius or travel distance

D&B Market Insight
Here to help
With our marketing platform D&B Market Insight we help you gain insights into your market, target group and customers so you can create more successful campaigns.

Analyse your current sector performance
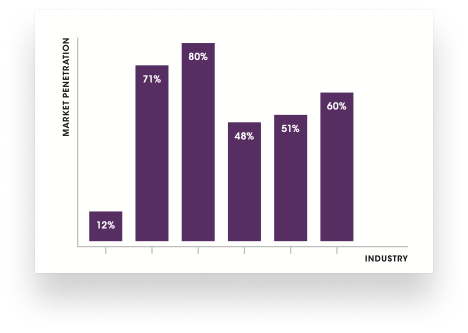
Inform your targeting decisions through common analytical techniques including market penetration, customer profiling analysis or the patented Predictive Weight of evidence scoring (PWe).
- Discover market penetration
- Understanding your strengths & weaknesses across market sectors
- Compares your customer base against the prospect universe by profiling
- PWe scoring brings your look-a-like analysis to the next level
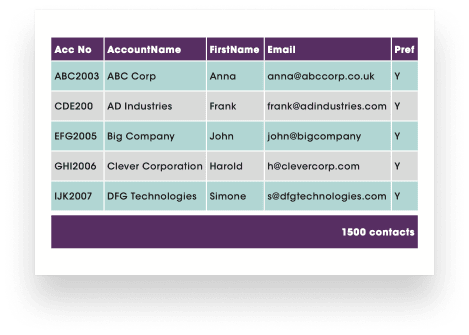
Turn insights into actionable data
Check the data selected in previous steps or prepare your data grid for further actions in your marketing campaigns.
- View the final outcome and select the data elements you wish to export
- Verify the rule that led to each record with the ‘why was I selected’ option
- Define templates for frequently used lay-outs to save time
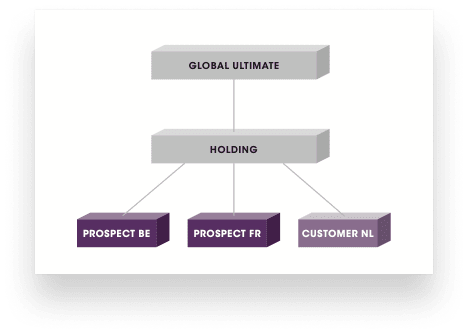
How are customers and prospects related?
Linkages provides insight in family structures, “who owns who” and how companies are related globally.
- Reveal family structures and explore cross sell opportunities
- Creates a spend analysis on a corporate level
- Corporate cross selling insights into new markets
Would you like to know more about D&B Market Insight?
Please contact us for a demo. We are happy to show you everything D&B Market Insight has to offer.
Legal view versus Commercial view
The way in which a company registers, compared to how your Sales & Marketing want to perceive them often does not match. Important indicators such as Industry Codes, Sales and employee sizes are often not reflected on company registration. Within corporations, many Legal entities are registered at the local Chamber of Commerce. These different registrations are required for legal agreements, but do not represent the true Commercial values of a company.To align this data, Market Insight can consolidate, deduplicate and harmonize related Legal entities into a Commercial View of their:
- Global values
- Domestic values
- Location values
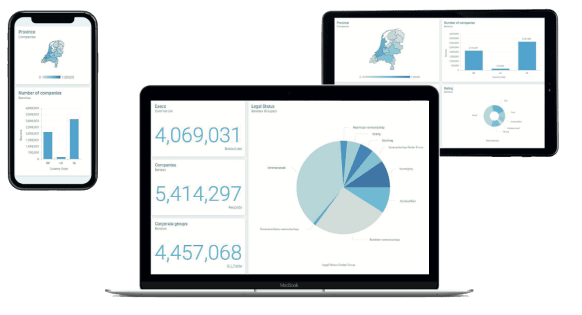
Easy to use
Market Insight’s Orbit is a browser-based, platform-independent sharing application. It allows you to deliver dashboards to colleagues and share insights with non-Market Insight users. The smooth responsive user interface guarantees a uniform user experience on tablet, phone or laptop.Orbit updates dashboards automatically as they are opened to reflect the latest data refresh of the Market Insight system, ensuring your visualizations remain up to date.
- Access dashboards and reports from any device or browser
- Review your collated data analysis and metrics wherever and whenever you need
- Share your dashboards with a wider audience - inside and outside your organization
- Control sharing access with email domain restrictions, ensuring that your insights and data remain available only to those who need them
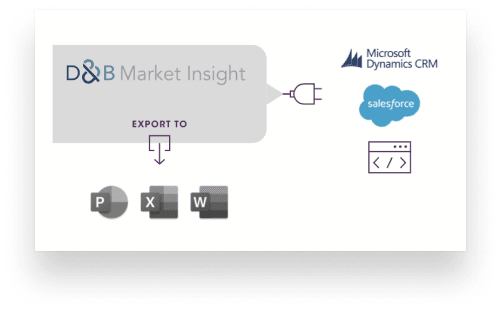
Share and reshare your data
Want to share actionable data on a regular base? export directly to excel, Word or PowerPoint. easily schedule automated exports to share data via e-mail or STP in your own format (csv, txt, etc.)
Make the circle complete and unlock essential data from Market Insight for Salesforce or Microsoft Dynamics CRM.
Our Application Programming Interface (API) allows you to communicate directly with Market Insight. You can access your selections, data grids and cubes and integrate them with your self-developed applications.
It provides packages for Python or R that can be used by data scientists to create bespoke dashboards. Making its possibilities unlimited.
What can we help you with?
I want to map my market and market potential
Knowledge and understanding of your market is critical to your success. The Dun & Bradstreet Data Cloud is the largest of its kind and allows you to conduct comprehensive analysis, understand your market share and market penetration, and uncover growth opportunities.
How many companies are there actually within a particular region and how big are these companies? How many companies are active within a specific branch and how many people are employed there? You can quickly and easily make counts and selections in D&B's international companies database on the basis of many criteria. This gives you an insight into where you can best focus your efforts and where your chances of success are the greatest.
Read More
I want to optimize the results of my marketing campaigns
You don't want to shoot with hail and aren't waiting for piles of mail returns. The Dun & Bradstreet Data Cloud guarantees high-quality prospect files with a high conversion rate.
Read More
I want to know what the corporate structure of my relationship looks like
Many companies place their activities with several legal entities at home and abroad. The stakeholders in the Netherlands are often transparent via public sources, but what does such a group structure look like globally?
The global Dun & Bradstreet Data Cloud gives you insight into the worldwide group structures of your business relations. For example, you may discover that almost 70% of Dutch private limited companies are linked via shares to another company in the Netherlands or abroad. More than 30% of Dutch BVs and NVs have a link to another country.
Read More
I want to understand the cross and upsell opportunities with my customers
It is a well-known fact that acquiring a new customer is 5 times more expensive than retaining an existing one. But did you know that there are often many opportunities and possibilities within your existing customers?
Perhaps you sell relatively little to a very large company. Or perhaps a 'small client' turns out to be part of a large concern. With the Altares Dun & Bradstreet information you can uncover new opportunities and possibilities within your existing client portfolio. These have a much greater chance of success than cold leads.
Read More
I want to find the most profitable prospects
Looking for a better return on your expensive acquisition campaigns? Selecting the right target audience is a big step in the right direction. We help you use our data, insights and tools to select the most profitable prospects based on hundreds of criteria.
By prospecting intelligently and focusing on the best prospects, you increase the chances of success for your campaigns in both the short and long term. The question is: how do you select these prospects?
Read More
