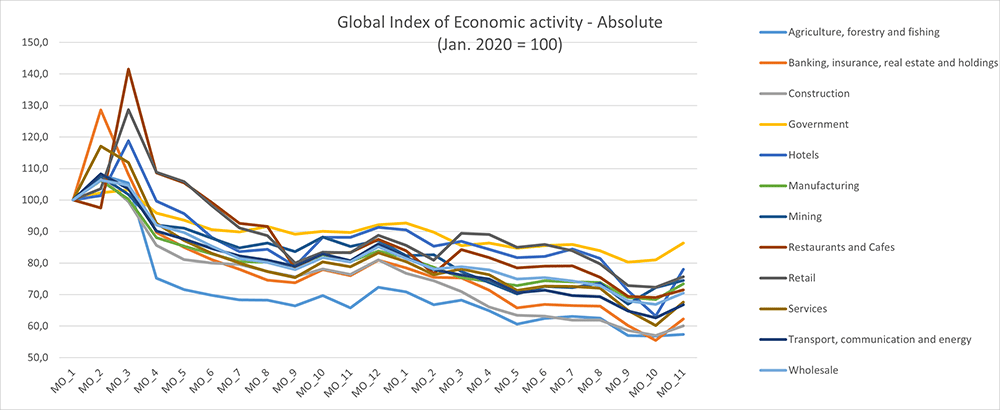
During the first months when Covid-19 kicked in, Altares Dun & Bradstreet's Data Scientists developed an index that could measure trading intensity. The goal of this was to support our clients with relevant, forward-looking and actionable insights from our data.
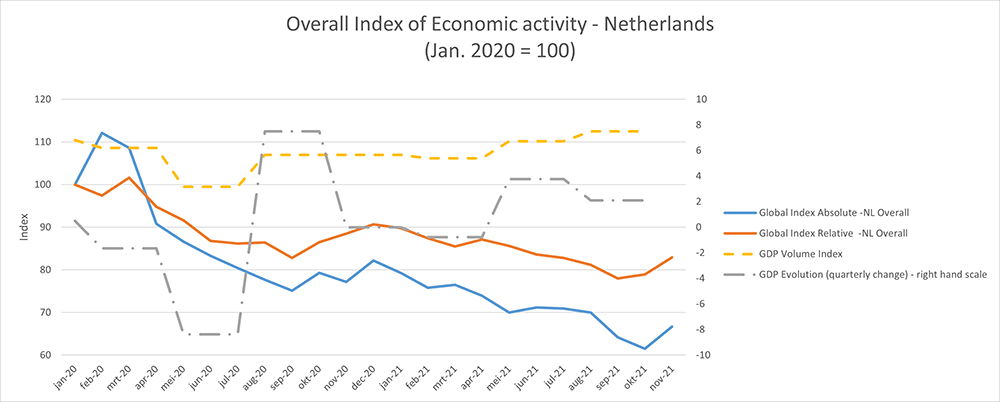
During 2020, we established that our index is a leading indicator of overall economic activity in both the Netherlands and Belgium. This was confirmed during 2021: when the government statistical agencies released the final GDP figures for 2020, they also revealed persistent weakness in the economy for 2020. In 2021, the incoming actual data showed again and again that the state of the economy was not as strong as the agencies had predicted. For both years, however, our trade intensity index had shown this persistent weakness well in advance.
The imperfect but strong relationship between our trade intensity index and GDP
In October and November 2021, our index continued to indicate continued weakness in the economy. At first glance, this seems to be in stark contrast to the recent "euphoric" sentiment of economic growth.
However, caution should be exercised in interpreting the figures and reports of official government statistical agencies and their forecasts. Most of them focus on the classic year-to-year comparison. Certainly, 2021 is better in this light than 2020 was. But compared to 2019, the official figures also show that the economy in 2021 is still far behind its pre-pandemic performance.


In a recent publication on the third quarter of 2021, CBS highlighted that:
- GDP grew by 1.9% over the previous quarters;
- this growth was entirely driven by government spending (on vaccines and medical care) and households;
- total business investment declined.
Source: https://www.cbs.nl/en-gb/news/2021/46/economic-growth-of-1-9-percent-in-q3-2021
A similar picture has emerged for Belgium. In its recent publication, the NBB/BNB pointed out the same elements that play a role as for the Netherlands.
Source: https://www.nbb.be/en/articles/belgian-economic-activity-expected-increase-02-last-quarter-2021
Our data set does not fully capture the effects of government spending and household consumption patterns. However, we do record the intensity of investment, trade and services, which are known to drive future GDP development.
In both countries, official government agencies have subsequently confirmed that business investment is in fact still lower than in 2019. In short, the recent publications by these government agencies are in line with what our trade intensity index has been showing for a while: a strong rebound to solid economic growth -driven by all contributors to GDP- is not likely in the short term.
Thus, while the relationship between our index and GDP is not perfect, the trade monitor appears to be a strong leading indicator of (near) future economic growth.
What will this mean for 2022?
Since our index provides a good picture of the future state of the economy, the continued moderate level suggests that a strong economic recovery is not likely before 2022.
Faced with uncertainties around the labor force, inflation, supply chain stability, and government actions, companies will proceed with caution. Investments will be scaled back or even postponed. As a result, active management of cash flows and costs will be a key topic at the CFO/CEO's table.
Advice from the Data Scientist
Keep in mind that situations such as lock downs, or far-reaching imposed measures from the government may well become more common. Hopefully with the Omikron variant, we have had the last big wave of the corona virus, but of course that is not certain. My advice is to keep a close eye on your cash flow. This means making sure that invoices are paid by your customers properly and on time. If you notice delays, it's best to discuss this with the customer as soon as possible.
As the number of bankruptcies begins to rise, so does the risk again. While we are at historically low levels, external factors can change this at a rapid pace. Think of continuing lockdowns and the possible clawing back of concessions from the government over the past 2 years. This could just cause a snowball effect.
If you can, participate in an exchange program around payment experiences. By submitting your own billing information, the information office will also give you insight into how your customers are paying others. Don't see any signs yourself yet? It may be that others have. The better you can see this, the better you can continue to monitor your cash flow.
Lastly, stay creative and stay relevant. A lot of entrepreneurs have proven that during previous lock downs they could successfully come up with very creative ideas. Continuing with this momentum is certainly a recommendation. If necessary, already work out some scenarios for what is expected to await us: higher energy costs, inflation, labor shortages, and uncertainty in the supply of goods and services. Calculate what the impact would be on your organisation. They do not have to be doom-and-gloom scenarios, and of course they are only simulations, but being prepared for a storm is always better than being caught unawares.
Joris Peeters – Chief Data Scientist, Altares Dun & Bradstreet
